


A plain-English guide to indoor particulate matter — what PM2.5 vs PM10 means, why there is no federal standard for the air inside your home, and the source-first intervention order that actually works.
By Jeff Bradley, CIEC, CMC — Owner of IndoorDoctor since 2009 · 30,000+ New England inspections · Testing-only, no remediation
Table of Contents
- Why your house feels dustier than the number on the app says it should
- Indoor particulate matter, explained: why size is the master variable
- Why your house feels worse from November to March — and what Boston’s wood smoke is doing in your bedroom
- There is no federal indoor particulate matter standard — here is the tiered framework that actually works
- “Bad air” is shorthand for five distinct categories — and consumers treat them as one
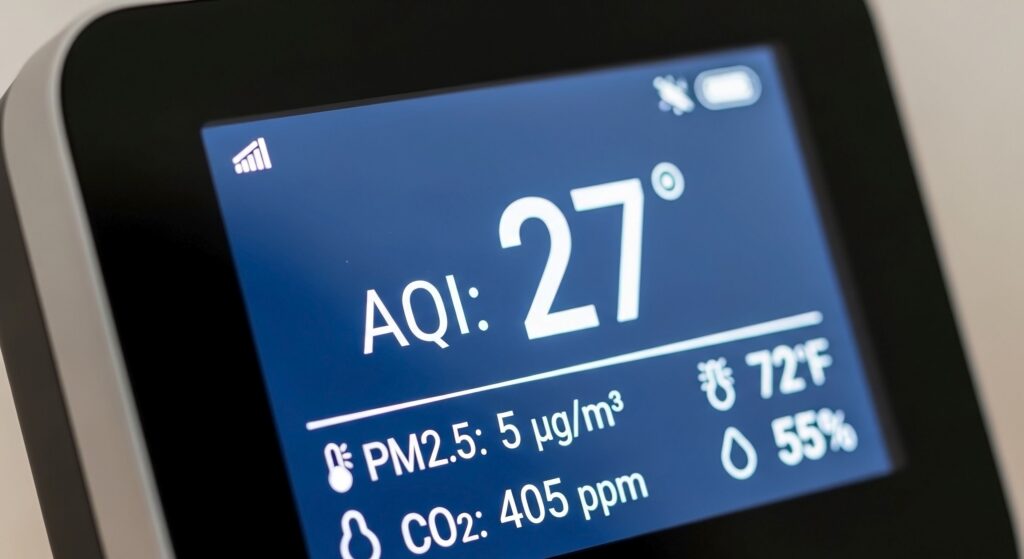
- Why your monitor reads “0” when the air isn’t clean — and how to use it well anyway
- The intervention hierarchy that actually works: source, then ventilate, then filter
- What a “HEPA” label actually delivers in your actual room
- Devices to avoid: ozone generators, ionizers, and “plasma” purifiers
- Your vacuum is broadcasting particles it pretends to capture
- The travel test: when your symptoms improve away from home
- Who does what: your HVAC tech, your doctor, and a particle scan
- When to escalate: the Four Signals rubric
- What a professional particle scan measures that a consumer monitor cannot
- FAQ
- Resources
Why your house feels dustier than the number on the app says it should

If you can write your name in the dust on the piano two days after cleaning — or you’ve noticed the dark furniture resettling faster between November and March — your house is producing a signal, and you’ve been reading it correctly. The question this article answers isn’t whether the signal is real. It’s what’s actually in the air when you breathe it, why the $50 monitor on your counter may be telling you “zero” while that signal gets stronger, and why the first thing most homeowners buy to fix it is usually the third or fourth thing that should happen.
This is a plain-English guide to indoor particulate matter — what PM2.5 vs PM10 actually means, why there is no federal standard for particulate matter indoor air quality inside your home, and the source-first intervention order that actually works. We’ll walk through why size matters more than the number on any screen, and — because there is no federal standard for the air inside your house [29] — how to navigate without a map.
Here’s the thing about the reader who notices dust on dark wood before they notice anything on a sensor: that observation is mechanistically real. Walking across carpet or a rug resuspends coarse particles at roughly thirteen times the rate it resuspends PM2.5 [5]. You have a reservoir of particles on every soft surface in the house, and the normal motion of people and pets lifts the coarse fraction back into breathing-zone air for two hours or more. That’s not a failure of cleaning. It’s the physics of particles larger than a micron behaving like particles — landing, resting, lifting, landing again.
One homeowner on an HVAC forum described it this way, and it’s a line that lands for anyone who keeps a home with any dark surfaces:
A day or two after the housekeeper goes through, the dark furniture was noticeably dusty. It’s odd though — it only happens in the winter. Never in the summer.
— Homeowner, HVAC-Talk forum thread, 2023 [18]
Indoor particulate matter, explained: why size (not the PM2.5 vs PM10 label) is the master variable
Particulate matter — PM, for short — is any mix of solid particles and liquid droplets suspended in air. It comes in every size from a grain of visible sand down to a cluster of molecules you’d need an electron microscope to see. The usual shorthand groups particles by aerodynamic diameter:
- PM10 — particles up to 10 micrometers across. Visible in a slanted sunbeam. Large enough that the nose and throat catch most of them before they get anywhere [30].
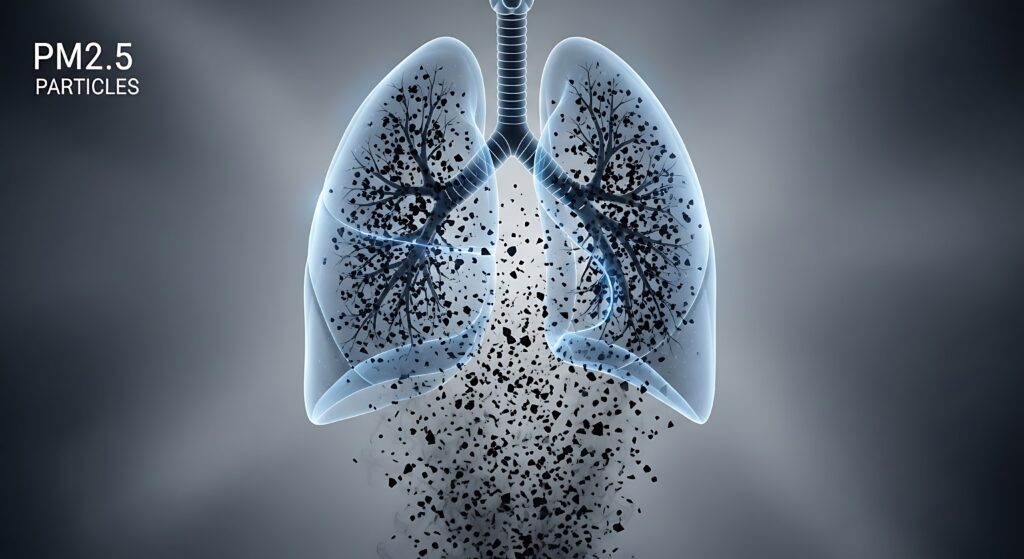
- PM2.5 — particles up to 2.5 micrometers. Small enough to slip past the upper airways and reach the alveoli, where the air-blood barrier is one cell thick [30].
- PM1 — particles up to 1 micrometer. A subset of PM2.5, mostly going the same places as PM2.5 but even smaller.
- PM0.1 (also called ultrafine particles, or UFP) — particles under 100 nanometers. At this size the particle is no longer just a lung problem. Ultrafines can cross the alveolar barrier into blood, and along the olfactory nerve into the brain [3].
The deposition hierarchy is what makes size matter. A 10 micrometer particle: about 90% lands in the nose and throat, only 3% reaches the alveoli [30]. A 0.1 micrometer particle: the numbers invert — about 80% reaches the alveoli [30]. PM2.5 is a regulatory convenience, not a biological cliff. Smaller goes deeper, and the body’s defenses thin out the further in you go.
Ultrafines — the sizes below consumer-sensor resolution — can cross the alveolar epithelium into blood, travel the olfactory nerve into the brain, and have been linked in consensus reviews to roughly a 10% increase in cardiovascular mortality per 10 µg/m³ of long-term PM2.5 exposure [3][4][30].
Preview for the measurement section below: your $100 consumer monitor is structurally blind below roughly 0.26 micrometers [9]. The sizes that translocate to blood and brain are the sizes the monitor can’t directly see. It extrapolates. That matters for how to read its output, which is covered in Section 6.
Why your house feels worse from November to March — and what Boston’s wood smoke is doing in your bedroom
The tactile-first New England homeowner notices it first. The dust comes back faster. The mornings get rougher. The cough that was a summer afterthought becomes a 3 am wake-up in January. And the paradox: the outdoor AQI app is usually showing green in the coldest months, because outdoor ambient PM2.5 runs lower in winter than in summer across most of the Northeast.
The AQI app is telling you about the wrong air. Here’s the physics of what’s happening inside:
Your envelope closes up. Windows stay shut, doors stay closed, and outside-to-inside air exchange drops. Forced-air heating kicks on. Every cycle of the furnace or boiler fan stirs settled particles back into breathing-zone air, and with the envelope tight, those particles have nowhere to go. Indoor relative humidity drops — forced air heating pulls RH into the 20–30% range in most NE homes, sometimes lower. At low humidity, particles dry out, shrink, stay airborne longer, and charge electrostatically enough to cling to fabrics and release again with motion [13].
The coil on an oil or gas furnace ages, releasing a fine dust of corrosion products; return-air ducts running through attics pull attic dust into the supply stream. In the homes our team scans across New England — from older Derry colonials to post-war Cape Cods — these four mechanisms stack on top of each other every heating season.
Then there’s the piece most homeowners haven’t heard: wood smoke from your neighbors. Roughly 35% of Boston’s winter PM2.5 comes from wood burning — and much of that wood isn’t being burned in Boston itself [16]. It’s being burned in rural suburbs to the west and south, carried by prevailing winds into the urban core, and infiltrating into pre-1980 housing stock that was never designed to seal against the particle sizes involved. Only about 2% of US households burn wood as their primary heat, but nationally wood smoke contributes over 20% of total air pollution [16]. That means even if you don’t burn wood yourself — even if you’ve never owned a fireplace — a significant fraction of your winter indoor PM2.5 is likely coming from combustion you have no control over, in houses you don’t know.
A long-time Austin Air owner described the heat-on moment this way:
I bought my first Austin Air HealthMate for my bedroom because of the dust that was coming from our vents when we turned on the heat. It was so bad that I would gag and cough, and it was waking me up at 3 am every morning.
— Longtime Austin Air reviewer, 15+ years of ownership [19]
That’s the physics landing as lived experience. The heat came on. The particles that had been resting on duct interiors, furniture, bedding, and filter media for seven months got stirred. And the outdoor air she wasn’t opening the windows to — that was carrying its own load from two towns over.
One note on order of intervention: we’ve been arguing throughout this piece that source control comes first. Winter wood smoke is the clearest case where filtration legitimately moves up the list — because the source isn’t yours to eliminate. You can’t call your neighbor and ask them to stop burning. You can seal your envelope, run a properly-sized portable HEPA in the rooms where you sleep and spend time, and change your outdoor air strategy. More on that in the intervention hierarchy section. The outdoor AQI app isn’t helping you here; it’s a forecast tool for outdoor ambient air, not an indoor predictor. In New England heating season, those two numbers tell different stories — and that gap is exactly what an IndoorDoctor particle scan is built to close.
There is no federal indoor particulate matter standard — here is the tiered framework that actually works
The first surprise about indoor air quality is that there is no federal standard for it. EPA’s NAAQS regulate outdoor air [1]. OSHA’s PEL regulates workplace air, and is about 500 times looser than what applies to a home — if anyone ever quotes you “5 mg/m³” as a safe indoor number, that’s an occupational limit for an adult worker, not a threshold for your children, your elderly parent, or yourself over a lifetime [6]. The WHO publishes non-binding global guidelines [2]. NASEM has produced a consensus study on indoor PM health risks but no regulatory number [29]. No agency sets a number for the air in your living room.
Consumers end up borrowing outdoor numbers for indoor decisions — and there is no single right answer to borrow. What works is a framework that tells you where each number comes from.
The tiered PM2.5 framework our team uses:
| Value | Tier | Description |
|---|---|---|
| 9.0 µg/m³ annual | Tier 1 · Regulatory Floor US EPA NAAQS — Outdoor regulatory standard | Tightened in February 2024. This is the outdoor regulatory floor — the minimum your outdoor ambient air has to meet. For indoor air, it is a ceiling that is probably too loose. Typical US indoor PM2.5 averages about 11.6 µg/m³, which already exceeds this floor. |
| 5.0 µg/m³ annual | Tier 2 · Health-Based Guideline WHO Air Quality Guidelines — 2021 revision | Tightened from 10 µg/m³ because health effects were being documented below the old threshold. Non-binding global reference. This is what serious indoor air practice in other developed countries is moving toward. |
| ~2.5 µg/m³ PM2.5 | Tier 3 · IndoorDoctor Practitioner Target The target our team aims for in homes we test | IndoorDoctor’s practitioner target of ~2.5 µg/m³, reflecting current dose-response evidence. Think of it as the target a practitioner aims for when they have real agency over the room. |
And a parallel anchor for PM10:
| Value | Tier | Description |
|---|---|---|
| ~10 µg/m³ PM10 | IndoorDoctor Practitioner Target · PM10 For indoor coarse-particle mass | Not a federal standard — the EPA’s outdoor 24-hour PM10 NAAQS sits at 150 µg/m³ [1] — but the number our team uses inside the homes we test, where coarse-particle resuspension from carpet, fabric, and forced-air systems is the dominant indoor PM10 driver. |
What this tiered frame gives you is a way to read any number you encounter. A homeowner forum post debating whether 15 µg/m³ is “safe” becomes a framework question: 15 is above all three tiers. An indoor reading of 6 is below EPA’s outdoor floor, around WHO’s guideline, above the practitioner target. The answer to “am I fine?” is “fine relative to which tier, and for which occupants.” That’s closer to how IAQ professionals actually think.
“Bad air” is shorthand for five distinct categories — and consumers treat them as one
Here’s a small honest move that most air-quality content skips: “bad air” is shorthand for at least five distinct categories, each with its own mechanism, its own test, and its own response. Particulate matter is one of them. It’s a category consumers miss more often than they miss anything else — partly because fine particles are invisible at the sizes that matter, and partly because the consumer monitor market has created false confidence in readings that don’t see them. But it is not the answer to every indoor complaint.
The other categories:
- Mold and biologicals — spores, fragments, mycotoxins (detailed in our guide to mycotoxin testing), bacterial byproducts. Tests look different. Interventions look different.
- VOCs — volatile organic compounds from finishes, cleaners, fragrances, off-gassing materials. Gases, not particles; carbon filtration helps, HEPA doesn’t.
- Combustion byproducts — NO₂, CO, and combustion-specific particles from gas ranges, oil furnaces, wood stoves, vehicle exhaust in attached garages.
- Radon — a gas entirely, mostly from soil beneath the house. Its own test, its own mitigation.
If you’ve been dealing with a persistent indoor air issue and you’re about to spend on a PM-specific intervention, the honest question is whether PM is actually your driver. In the homes our team tests across New England, PM isn’t always the driver — which is why our panels span mold, VOCs, and combustion byproducts. Diagnosis first, purchase second.
Why your monitor reads “0” when the air isn’t clean — and how to use it well anyway
My indoor air quality is almost always at PM 2.5 = 0. Recently, it has started jumping up in the middle of the night for no apparent reason. Today it jumped up in the afternoon when no one was even on this level of the house.
— Homeowner, r/AirQuality, 2025
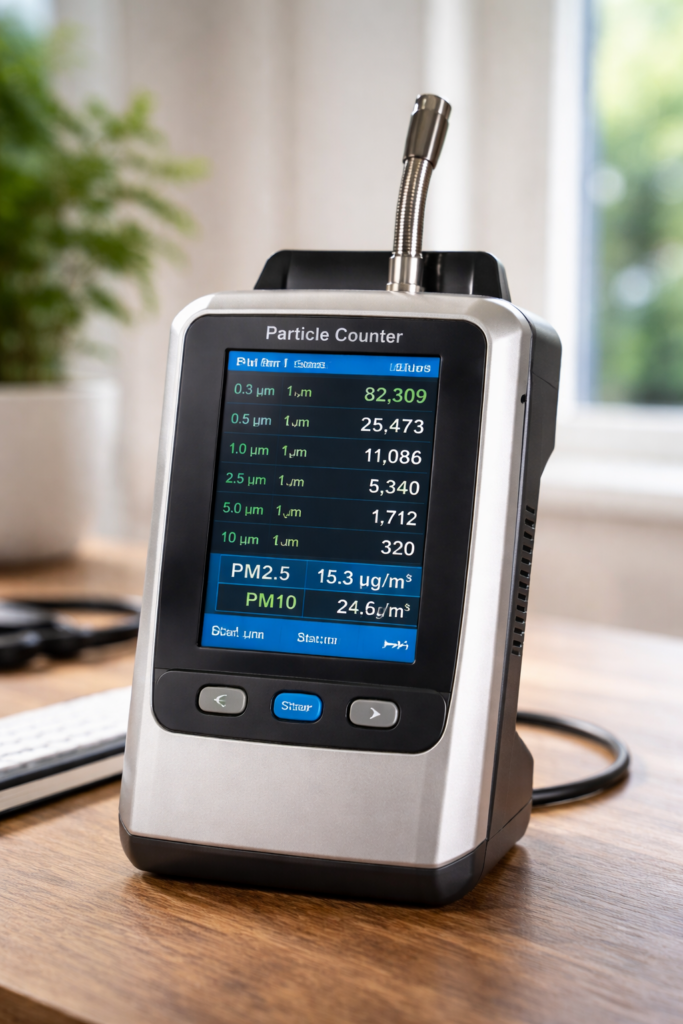
Here is what that reading is probably telling the homeowner. The $50–$300 monitor on the counter likely uses a Plantower PMS5003 sensor or something in its class — the same sensor inside most consumer PurpleAir, Temtop, IKEA, and Amazon-branded devices [9]. It works by shining a laser beam through a small volume of air and counting the flashes as particles cross the beam.
Three honest limits:
- There’s a floor. The sensor can’t reliably see particles smaller than about 0.26 micrometers — including most of PM1 and all of PM0.1 [9]. The sizes most relevant to deep-lung deposition and cardiovascular effects are exactly the sizes the monitor can’t resolve directly. The monitor reports PM1, PM2.5, and PM10 by extrapolating from what it can count, using assumptions about particle density and shape.
- Zero is usually a floor artifact, not clean air. The algorithm inside many consumer sensors truncates low readings to zero rather than reporting a noisy low number. A “0” at 2 am doesn’t mean the air had no particles. It means the sensor didn’t detect enough scattering to exceed its internal threshold. An independent laboratory analysis of specific hardware batches documented consumer-grade sensors under-reporting by a factor of 30× at low concentrations [31].
- Humidity inflates readings. At relative humidity above about 50%, water coats particles and makes them look optically larger. Correction research has found raw consumer-sensor data overestimating PM2.5 by roughly 40% in humid conditions [11]. The reading is real — as an optical signal — but the dry particle mass is lower than the display suggests.
Add to these the auto-mode problem: many purifiers with onboard sensors use this same sensor class to decide when to ramp up the fan. Because the sensor under-reads at low concentrations, auto mode often leaves the fan on its quietest setting while PM is slowly rising. One documented product analysis found auto mode leaving PM2.5 above WHO guideline levels for 86% of measured hours, because the onboard sensor under-reported actual PM2.5 by up to 218 µg/m³ [17]. The fix: run your purifier on a fixed low-to-medium speed continuously, not on auto.
Now the rehabilitation, because we’re not telling you to throw the monitor away. Your monitor is a trend instrument, not a value source. Used that way, it earns its price:
- Establish a 72-hour baseline when nothing unusual is happening. Log the typical range for your home — the “normal” peaks from cooking, the quiet hours at 3 am, the weekend patterns. That baseline is what makes spike detection possible.
- Flag events at 50%+ shifts from baseline. An absolute reading of 15 might be concerning or routine depending on your house. A shift from your baseline of 5 to a reading of 15 is always worth investigating.
- Use it for forensics. One homeowner’s mystery dust turned out to be a central air vent: “I determined just now that it’s a central air vent. Putting the sensor near the vent made it higher, turning off the A/C made it come down quickly.” — Homeowner, r/AirQuality, 2025. That’s the monitor earning its keep — not as a value source, but as a search tool.
- Use it for A/B testing. Before and after you upgrade your HVAC filter, try a new vacuum, change cooking habits. The relative change is trustworthy even when the absolute number isn’t.
The monitor tells you something is varying. That’s real information, worth having. It doesn’t tell you what varied, where it came from, or what to do about it. Those are different questions — and they’re where a professional IndoorDoctor particle scan with live Zoom consultation enters the picture. The Zoom consultation our team pairs with every scan exists precisely for this interpretive layer: the monitor tells you something varied, our team tells you what varied and what it means for your house.
The intervention hierarchy that actually works: source, then ventilate, then filter
Most residential air-quality advice on the internet inverts the correct order. The consumer reads “bad air” and clicks “best air purifiers.” The purifier arrives, runs, and — if it’s the right size for the room, placed correctly, and running continuously — makes some difference. But it’s fighting a source that hasn’t been addressed. It’s a third-line intervention being used as the only line.
Occupational hygienists worked this out fifty years ago. The NIOSH Hierarchy of Controls ranks exposure-reduction strategies: Elimination first, then Substitution, then Engineering Controls (ventilation and filtration), then Administrative Controls, then PPE [28]. The logic is that each lower step relies more on human behavior and has more ways to fail. EPA’s own indoor air guidance says the same thing in slightly different words — source control first, ventilation second, filtration third, and “air cleaning is not a substitute” for the first two [15]. The consumer market has commercial incentive to sell filters and no incentive to sell “stop using the candle,” so the ordering got quietly reversed.
Here’s how that translates to your home. This is also the intervention order our team walks families through during the Zoom consultation that comes with every IndoorDoctor scan — because it’s the order that actually reduces exposure.
First: source. What is actually producing the particles? Cooking is the single largest indoor PM2.5 source for most US homes. Pan-frying can raise kitchen PM2.5 by 100× in minutes [33b] (median peak around 93 µg/m³ [10]); stir-frying, deep-frying, and boiling each produce measurably different loads [10]. The highest-leverage intervention in most American kitchens isn’t a purifier. It’s turning the range hood on when the stove goes on, cooking on the back burners when possible (the hood captures more), and leaving the hood running 10–20 minutes after cooking ends [15]. That advice costs nothing. It beats any $500 purifier running in the living room while a plume of oil aerosol rises off a hot pan 20 feet away.
After cooking, common sources include candles, fireplaces (even well-maintained ones vent incomplete combustion), incense, smoking, vacuuming without a sealed HEPA machine, and for rentals or older homes, outdoor-air infiltration through leaky envelopes.
Second: ventilate. Which way is the gradient? Indoor source — vent outward, open a window on a clean-outdoor-air day, run exhaust fans. Outdoor source (wildfire smoke, wood smoke from neighbors, high-pollen day) — seal and filter. The same window that solves one problem makes the other worse. Conventional “open a window” advice assumes indoor-dominant sources; in winter NE or during wildfire infiltration, the answer reverses.
Third: filter. This is where a portable HEPA earns its keep. After the source is addressed and ventilation is working in the right direction, a properly-sized HEPA unit running continuously at low-to-medium speed catches the residual. We’ll get into the sizing math in the next section, because “HEPA” on the box and “HEPA in your actual room” are two different things.
If you already have a purifier, you’re not wrong — but you may be skipping cheaper, higher-leverage steps. We’re not telling you to throw out the Coway or the Austin Air. We’re telling you to check whether the range hood is on, whether the candles are gone, whether the vacuum is sealed, before deciding the purifier is the thing that isn’t working.
(Three situations legitimately invert this order: rentals without envelope authority, acute outdoor events like wildfire smoke, and homes near unremediable outdoor sources [27]. In those cases, sealing and filtering moves up the list. In every other case, source-first holds.)
What a “HEPA” label actually delivers in your actual room
A True HEPA filter captures 99.97% of particles at the most penetrating particle size [7] — that part is real. What isn’t real is the room-size claim on the box. A purifier rated “up to 500 square feet” is often assuming 1 air change per hour. AHAM (the Association of Home Appliance Manufacturers, the industry body that certifies purifier performance) sets its health-benefit standard at 4.8 air changes per hour [22]. The math:
ACH = (CADR × 60) ÷ Room Volume in ft³
Where CADR (Clean Air Delivery Rate) is AHAM’s industry measure of how much filtered air a unit actually moves, expressed in cfm (cubic feet per minute of clean air delivered). So a purifier with a CADR of 250 cfm in a 12×15×8 ft room (1,440 ft³) delivers about 10 ACH — comfortably above the AHAM standard. The same unit in an open-plan 900 sq ft great room delivers only about 1.7 ACH. The label said “up to 500 sq ft” but assumed conditions you don’t have.
For scale: a hospital operating room runs 20+ ACH, a patient room runs 4–6, a typical US home runs around 0.35 natural [20]. A bedroom HEPA at ~4 ACH delivers patient-room-grade filtration. That’s worth doing — it isn’t total elimination, but it’s the room where you sleep, brought to the level of post-surgical hospital care.
Placement matters more than marginal CADR. Smart Air’s tests on placement showed that a purifier in a corner behind furniture can deliver less than 10% of its optimal performance [32]. Three-foot clearance on intake and exhaust faces. Central placement, not tucked behind the couch. And critically — place the unit in the source room, not the adjacent one. If cooking is the source, the kitchen gets the purifier. Moving it to the bedroom “where I sleep” leaves the generation zone unfiltered.
Label literacy matters. “True HEPA,” “HEPA H13” (99.97%), and “HEPA H14” (99.995%) are real specifications. “HEPA-type,” “HEPA-like,” “HEPA-style,” and “99% HEPA” are unregulated marketing language [34]. In testing, some “HEPA-type” filters capture only 85–90% at 0.3 micrometers — meaning up to 15× more particles pass through than a true HEPA [34]. If you can’t find “True HEPA,” “H13,” or “H14” on the label, assume you’re looking at marketing.
Editorial Recommendation: Austin Air HealthMate. Sealed steel body, True HEPA media, and a medical-grade activated carbon/zeolite bed for VOC adsorption. Reviews from 45+ homeowners consistently report 10–15+ year ownership arcs — unusual durability in a category where most units are rotated every 3–5 years [19]. Not the lightest unit, not the quietest, not the cheapest. A long-haul tool for readers who plan to own one purifier for a decade.
Devices to avoid: ozone generators, ionizers, and “plasma” purifiers
Not every “air cleaner” cleans air. Ozone generators, corona-ionizer purifiers, and “plasma” devices all emit ozone as either their main mechanism or a byproduct. Ozone reacts with indoor VOCs — terpenes from cleaners and fragrances, off-gassing from furnishings, cooking byproducts — to produce formaldehyde and secondary organic aerosol ultrafines in the PM0.1 range [26]. That’s exactly the size fraction this article has been warning about. A device marketed as “particle removal” can be a documented PM0.1 generator.
California’s CARB maintains a banned-device list and enforces a 0.05 ppm ozone limit [27]. EPA’s fact sheet is unambiguous: ozone generators should not be used in occupied spaces [26]. If you see “ionization,” “ozone,” “plasma,” “active cleaning,” or “filter-free” in the marketing, read the fine print before buying. Mechanical HEPA-plus-carbon remains the safe default for residential use. IndoorDoctor can say this plainly because we don’t sell these devices — we test, we don’t remediate, and we have no financial stake in any product category.
Your vacuum is broadcasting particles it pretends to capture: sealed-system HEPA vs. HEPA-filter vacuums
The reader who writes their name in the dust two days after cleaning has an observation that most IAQ content doesn’t validate: the cleaning itself is part of the problem, if the vacuum isn’t right.
Here’s the mechanism. Walking across carpet resuspends PM10 at roughly 13× the rate it resuspends PM2.5 [5]. Vacuuming amplifies that — the beater bar agitates the carpet surface, the suction lifts settled particles, and if the machine isn’t a fully sealed system, a significant fraction of what it lifts gets exhausted back into the room. Measured penetration — the fraction of particles escaping a vacuum’s housing into breathing-zone air — ranges from 2% to over 30% in tested residential units [12]. A HEPA filter doesn’t fix this. The filter is meeting its spec. The housing, seals, exhaust ports, and bag interface are leaking fine particles around the filter.
The distinction is load-bearing: “HEPA filter” is not the same as “sealed HEPA system.” A sealed-system HEPA vacuum is built so that every cubic centimeter of air going in passes through the filter before going out — no leak paths past the housing seals. A HEPA-filter vacuum has a filter meeting spec but an unrated chassis. The latter is the vacuum many homeowners own without knowing the difference.
Sealed-system HEPA vacuums are a small group by design: FilterQueen Majestic, Miele non-Classic models, Nilfisk, and abatement-grade units. They cost more than a typical upright, they last longer, and they turn cleaning from broadcast into capture. For the 45+ homeowner who does their own cleaning and notices dust cycling back faster than the cleaning should account for, the vacuum is usually the first upgrade that changes the pattern.
Editorial Recommendation: FilterQueen Majestic. Sealed-chassis HEPA vacuum, multi-stage filtration, long brand history in the allergy-aware and chronically-ill communities IndoorDoctor serves. The distinction from a HEPA-filter vacuum is load-bearing: the housing is engineered so every cubic centimeter of air passes through the filter before going out — no leak paths past the seals.
Two other mechanical notes: wet-dust before dry-vacuum when possible (hard floors especially). A damp microfiber cloth captures what a vacuum will resuspend. And let the room settle before active occupancy — after vacuuming, airborne particle levels can take two or more hours to return to baseline [33]. If anyone in the household is respiratory-sensitive, cleaning the room they’re about to sleep in an hour before bedtime is worth reconsidering.
The travel test: when your symptoms improve away from home, your body is telling you something
Monitors and vacuums and filters are useful instruments — but for some homeowners, the clearest signal has come from a source that requires none of them.
We were recently away for 10 days — everyone felt great. Show up and the first morning we both feel like someone took a jackhammer to our heads, throats on fire again.
— Homeowner, r/HomeImprovement, 2022 [21]
No sensor captures that pattern. The homeowner doesn’t need a chart. They needed to leave.
The travel test is the strongest consumer-accessible diagnostic in the IAQ toolkit. Chronic low-level exposure creates tolerance that hides the problem. Removal — a vacation, a work trip, a hotel stay for a single night — breaks the tolerance. Return reinstates it, and the contrast is unmistakable. People who can’t afford a monitor can still run this test, and the signal is often clearer than any number a device would have given them.
The mechanism is straightforward. Your body is integrating exposure over every breath you take in the home. When you leave, the integral drops. The headaches, the morning congestion, the fatigue, the cough, the throat irritation — whichever of these patterns you carry — ease in the hours after you step out of the house. When you come back, they return, often within the first night.
If you’ve noticed a pattern like that and dismissed it because it “doesn’t make sense,” take it seriously. It’s not imagination. The body has been the sensor the whole time.
One caveat to bound the diagnostic honestly: the travel test is strongest when symptoms recur within 24 hours of return and when your travel didn’t also change your workplace, commute, or diet. If you were away from your office, your restaurant routine, and your home all at once, the test can’t tell you which environment was the driver. If you were away from only your home — a weekend at a family member’s, a work trip where you were in and out of offices similar to your own — the signal is sharper.
Who does what: your HVAC tech, your doctor, and a particle scan measure different axes
We did indoor air test, and everything came out normal. What could be the reason? And any solutions?!
— Homeowner, r/Allergies, 2024 [23]
The reader who has already tested, already heard “normal,” and is still asking the question is not neurotic, not rare, and not wrong. Professional IAQ inspection services in multiple states publish dedicated content on exactly this arc — “why your first inspection found nothing but you’re still sick” — because it’s common enough to build marketing funnels around [24]. Connecticut’s own Department of Public Health has acknowledged that absent health-based standards for indoor mold and most IAQ pollutants, “it is difficult to interpret the results of… air testing” [25].
Here’s a way to think about it. Three professionals measure different axes of the same problem:
| Role | What they measure |
|---|---|
| HVAC tech | Measures what the system is doing. Airflow, static pressure, duct leaks, filter condition, heat exchanger integrity. If a return duct is pulling attic dust into the living space, they’ll find it. What they don’t test: what’s in the air the system is moving. |
| Your doctor | Measures what your body is doing. Symptoms, immunology, differential diagnosis, treatment. If your symptoms are driven by a specific allergen, they can identify it. What they don’t test: the air you’re breathing when you’re not in their office. |
| Particle scan | Measures what’s in the air right now, in your house. Six size bins from PM10 down toward PM0.1, the fingerprint that identifies whether you’re looking at combustion particles, resuspension, outdoor infiltration, or something else. Paired with a live Zoom consultation that interprets the fingerprint against your specific house, your symptoms, your HVAC situation, and your family. |
Your HVAC tech tells you what the system is doing. A particle scan tells you what’s in the air it’s moving. Those are complementary measurements, not competing ones. If the tech tells you the ducts are tight and the filter is fresh and you’re still seeing tactile dust come back in 48 hours, the next instrument isn’t another duct cleaning — it’s characterization of what’s in the air. If a particle scan then comes back low, the right next step is a broader panel — mold (including attic mold testing when hidden moisture is suspected), VOCs, combustion byproducts — not more PM tests.
If any of that resonates, the Four Signals rubric in the next section is designed to help you decide whether professional testing is the right next step.
When to escalate: the Four Signals rubric
If you’ve been working through the at-home interventions and the signal isn’t resolving, here’s a checklist. Professional testing is the logical next step when two or more of these apply. One or fewer — keep troubleshooting the basics.
- Travel test positive. Symptoms resolve when you’re away from home and recur within 24 hours of return — when your travel didn’t also change your workplace, commute, or diet.
- The at-home hierarchy has stalled. You’ve identified and addressed the obvious source, upgraded to MERV 13 in your HVAC (if your system can handle it), added a right-sized HEPA purifier with adequate ACH in the source room, switched to a sealed-body vacuum — and the signal persists.
- Monitor-vs-lived-experience contradiction. Your consumer monitor reads low and your body says otherwise. Or your monitor spikes at times you can’t explain and your investigation has stalled.
- Medical screen is inconclusive. Your doctor has ruled out the obvious causes, allergy testing hasn’t revealed a sensitization that matches the timeline, and “just allergies” no longer fits the pattern.
If two or more describe your situation, a professional particle scan is the logical next step. Here’s how to book one.
What a professional particle scan measures that a consumer monitor cannot
We test in homes across New England — MA, NH, CT, RI, ME — from our base in Derry, NH. We’re a testing-only operation: we don’t do remediation, which means we have no financial incentive to find a problem that isn’t there or to miss one that is. That’s been our posture for 16 years and 30,000+ inspections.
The consumer monitor is a trend instrument — it tells you something is varying. A professional particle scan is a forensic instrument — it tells you what it is. And a Zoom consultation with a trained interpreter tells you what to do about it, in your house, for your family. Those are three layers of a single diagnostic journey.
What an IndoorDoctor scan structurally adds beyond a consumer monitor:
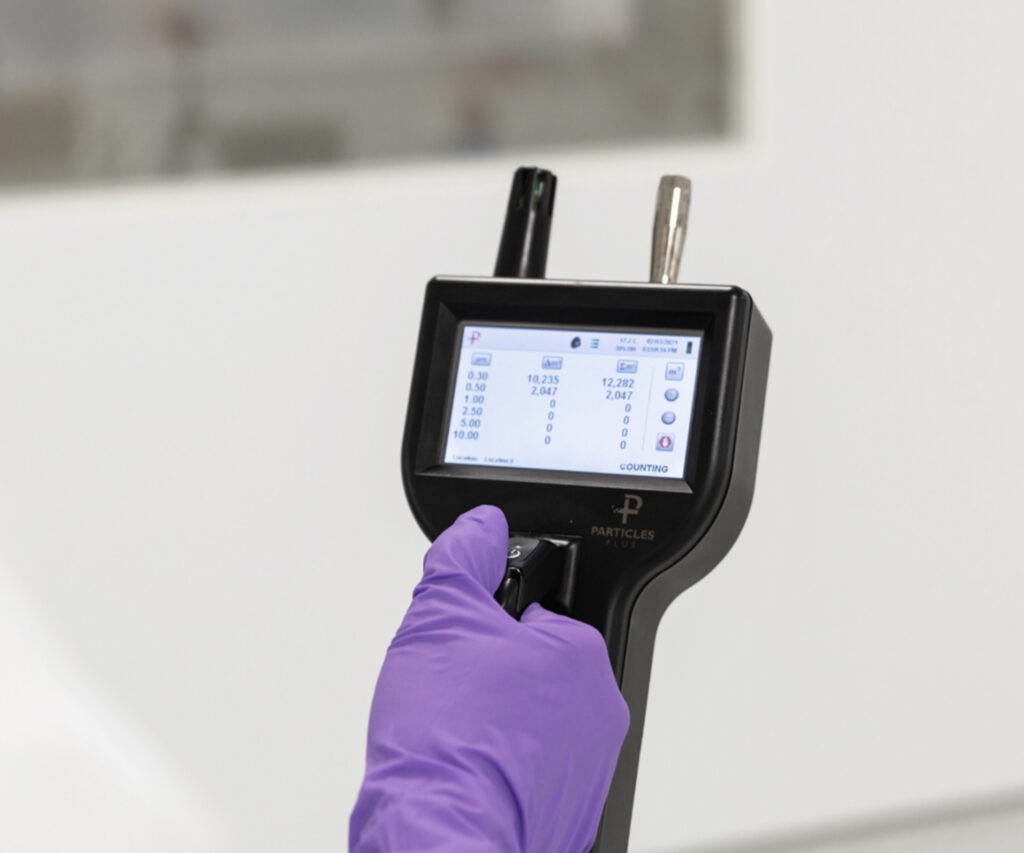
- A 6-channel laser particle counter (Particle Plus). Our team uses a Particle Plus 6-channel laser particle counter — the same instrument class used in cleanroom certification and pharmaceutical air-quality work. Six size channels span PM10 down through the ultrafine range, producing a forensic fingerprint that differentiates combustion from resuspension from outdoor infiltration in the room you’re standing in.
- Sheath-flow optics — a precision airflow design that forces particles through a focused beam for true sizing, rather than the diffuse scattering that consumer sensors use.
- NIST-traceable calibration — factory-verified against known-size reference aerosols maintained by the National Institute of Standards and Technology, not an approximation.
- Zoom consultation — the interpreter takes the fingerprint, looks at your house, your HVAC, your family’s symptoms, and your seasonal patterns, and translates the data into a household-specific narrative. That’s the layer consumer hardware structurally cannot deliver.
Screening to lab confirmation — how the scan fits into a full diagnostic workflow. The particle scan is a screening tool, not the full diagnosis. In a typical IndoorDoctor inspection, the scan runs first: room by room, our team watches the size-distribution fingerprint live and identifies the rooms where particle counts are elevated, where the size-bin signature suggests a specific source class (a combustion-tilt fingerprint reads differently from a resuspension-tilt fingerprint, which reads differently from an outdoor-infiltration fingerprint). That live screening is what tells us where to take the next layer of samples — air cassettes for mold spores, sorbent tubes for VOCs, allergen-specific panels for dander or dust mite, and so on. Lab analysis confirms what the particle data screened for. The scan answers “where and how much”; the lab answers “what.” The combination is what closes the diagnostic loop — and it’s why a scan that comes back unremarkable on PM still does useful work, because it routes the next layer of testing to the right targets instead of guessing.
If the navigation in this article resonated — if your house is telling you something and the map you’ve been using hasn’t given you the answer — we can help you read the terrain.
Ready to read the terrain. Schedule a professional particle scan with live Zoom consultation. Or contact our team to talk through what you’re experiencing. If you’ve been through prior testing and the result was “normal,” tell us about it — that’s exactly the conversation the Zoom consultation was built for.
Schedule a Particle Scan | Contact Our Team
Frequently Asked Questions
What is the difference between PM2.5 and PM10?
PM10 is particles up to 10 micrometers in aerodynamic diameter; PM2.5 is particles up to 2.5 micrometers. The difference matters because PM10 largely stops in the nose and throat, while PM2.5 reaches the alveoli of the lungs [30]. Both are regulatory categories; neither is a biological threshold. The continuum below PM2.5 — PM1 and PM0.1 — penetrates deeper still [30], [3].
Is there a consensus “safe” level of indoor PM2.5?
No jurisdiction sets a US federal standard for indoor PM2.5. The two most-cited reference points come from outdoor regulation and global health guidance: 9 µg/m³ annual (EPA’s outdoor NAAQS regulatory floor, tightened February 2024) and 5 µg/m³ annual (WHO’s 2021 health-based guideline, tightened from 10 µg/m³ because health effects were documented below the old threshold) [1][2]. Both are reference points homeowners borrow for indoor decisions; neither was set with residential indoor air in mind.
What target does IndoorDoctor work toward in the homes you test?
IndoorDoctor’s practitioner target is ~2.5 µg/m³ PM2.5 and ~10 µg/m³ PM10. These are the numbers our team aims for in the homes we test, reflecting current dose-response evidence that health effects continue to be documented below WHO’s guideline [4]. They’re not federal standards; they’re the targets a practitioner aims for when they have real agency over the room.
Why does my air quality monitor read zero?
Consumer laser-scattering sensors (including most Plantower-based devices) have a detection floor around 0.26 micrometers and typically truncate low readings to zero by algorithm [9]. A zero reading usually means “below sensor threshold,” not “no particles.” Use the monitor as a trend instrument — watch for spikes and shifts from baseline — rather than trusting absolute values.
Do I need a HEPA filter or is MERV 13 enough?
They serve different roles. A whole-home MERV 13 filter in your HVAC captures roughly 75% of particles from 0.3–1.0 micrometers [8], works continuously when your system runs, and is the practical residential ceiling for central filtration. A portable HEPA unit (True HEPA, H13, or H14) delivers higher single-pass efficiency in one room. Most homes with persistent PM concerns benefit from both — MERV 13 on the HVAC, portable HEPA in the source room or bedroom.
What about air purifiers with ionizers or ozone?
Avoid them. Ozone reacts with common indoor VOCs to produce formaldehyde and ultrafine secondary particles — generating new pollution while claiming to remove old [26]. EPA, CARB, and major IAQ authorities all recommend mechanical HEPA-plus-carbon filtration for residential use.
When should I test professionally?
When two or more of the Four Signals apply: travel test positive, at-home hierarchy stalled, monitor-versus-experience contradiction, medical screen inconclusive. See the full rubric above.
This content is provided for educational and informational purposes only. IndoorDoctor provides environmental testing services and does not provide medical advice. Particulate matter testing measures airborne particle concentrations in a sampled area; it does not diagnose health conditions. If you have health concerns related to indoor air quality or particulate matter exposure, consult a licensed healthcare provider.
Resources
Relevant Statistics
Key numbers from the research underpinning this article. Every stat is traceable to a primary source in the References table below.
| Statistic | Value | Source |
|---|---|---|
| Typical US residential indoor PM2.5, annual average | ~11.6 µg/m³ | Dyson Global Connected Air Quality Project, 2022 [14] |
| US EPA annual PM2.5 outdoor standard (NAAQS, tightened Feb 2024) | 9.0 µg/m³ | EPA NAAQS Table [1] |
| WHO annual PM2.5 health-based guideline (2021 revision) | 5 µg/m³ | WHO Air Quality Guidelines 2021 [2] |
| IndoorDoctor practitioner target for PM2.5 | ~2.5 µg/m³ | IndoorDoctor practitioner target (Section 4) |
| IndoorDoctor practitioner target for PM10 | ~10 µg/m³ | IndoorDoctor practitioner target (Section 4) |
| Pan-frying median peak kitchen PM2.5 | 92.9 µg/m³ | Tang et al. 2024 [10] |
| Kitchen 1-minute peak PM2.5 during typical cooking | 200–1,400 µg/m³ | Zhao et al. 2021 [33b] |
| Boston’s outdoor winter PM2.5 attributable to wood burning | ~35% | Northwestern / WBUR, 2026 [16] |
| Walking resuspension ratio, PM10 vs. PM2.5 | ~13× higher for PM10 | Benabed et al. 2022 [5] |
| Consumer PurpleAir-class sensor overestimation, humid conditions | ~40% | Barkjohn et al., EPA 2021 [11] |
| Consumer-grade sensor under-reporting at low concentrations | Up to 30× | AirGradient PMS5003 technical note [31] |
| HEPA filter efficiency at 0.3 µm (MPPS) | 99.97% | US EPA / DOE HEPA definition [7] |
| “HEPA-type” filter capture efficiency at 0.3 µm | 85–90% | HEPAcart / Molekule [34] |
| MERV 13 capture efficiency, 0.3–1.0 µm particles | ~75% | EPA MERV guidance [8] |
| AHAM health-benefit standard, portable air cleaners | 4.8 ACH | AHAM Verifide [22] |
| Purifier performance loss from corner placement | ~90% loss | Smart Air placement testing [32] |
| Typical US home air change rate (natural) | ~0.35 ACH | ASHRAE 62.2 [20] |
| Hospital operating room required air change rate | 20+ ACH | ASHRAE / AIA [20] |
| Standard vacuum penetration (fines escaping housing) | 2%–30%+ | Lisk et al. 2013 [12] |
| Post-vacuuming airborne particle decay time | 2+ hours to baseline | Corsi et al. 2008 [33] |
| PM2.5 cardiovascular mortality increase per 10 µg/m³ | ~10% | AHA Scientific Statement [4] |
Glossary
| Term | Definition |
|---|---|
| PM — Particulate Matter | Any mix of solid particles and liquid droplets suspended in air. Covers every size from visible dust down to clusters of molecules. |
| PM10 | Particles with aerodynamic diameter up to 10 micrometers. Large enough that the nose and throat capture most of them on inhalation. |
| PM2.5 | Particles up to 2.5 micrometers. Small enough to slip past the upper airways and reach the alveoli. The regulatory focus of most outdoor air standards. |
| PM1 | Particles up to 1 micrometer. A subset of PM2.5; not separately regulated in the US, but biologically relevant because most reaches the deep lung. |
| PM0.1 / UFP | Ultrafine particles under 100 nanometers. Can cross the alveolar membrane into blood and travel the olfactory nerve into the brain. No US regulatory standard. |
| HEPA | High-Efficiency Particulate Air filter, defined as capturing 99.97% of particles at 0.3 micrometers. “True HEPA,” “H13,” and “H14” are real; “HEPA-type,” “HEPA-like,” and “99% HEPA” are unregulated marketing. |
| MERV | Minimum Efficiency Reporting Value, ASHRAE’s 1–16 rating for HVAC filters. MERV 13 captures ~75% of 0.3–1.0 µm particles and is typically the residential HVAC ceiling. |
| CADR | Clean Air Delivery Rate — AHAM’s performance standard for portable air cleaners, expressed in cfm. Combines filter efficiency and fan speed into a single room-sizing number. |
| ACH | Air Changes per Hour — the number of times a room’s total air volume is replaced per hour. (CADR × 60) ÷ room volume in ft³ for a portable unit. AHAM’s health-benefit standard is 4.8. |
| MPPS | Most Penetrating Particle Size — the diameter (~0.1–0.3 µm) at which filter capture efficiency is lowest. HEPA ratings are specified at MPPS. |
| NAAQS | National Ambient Air Quality Standards — US EPA’s outdoor ambient air regulations under the Clean Air Act. Applies to outdoor air only; no federal equivalent for residential indoor air. |
| WHO AQG | World Health Organization Air Quality Guidelines. Non-binding global health-based reference values. The 2021 update tightened the annual PM2.5 guideline from 10 to 5 µg/m³. |
| Sealed-system HEPA | A vacuum whose entire housing — not just its filter — is designed so every cubic centimeter passes through the filter before going out. Distinct from “HEPA filter” vacuums, which can leak past the filter. |
| AQI | EPA’s public Air Quality Index — a 0–500 scale with six color-coded categories. Calculated on 24-hour PM averages; tightened in 2024. Designed for outdoor air communication. |
References & Citations
| # | Source | Organization / Author | Year | What it supports |
|---|---|---|---|---|
| [1] | National Ambient Air Quality Standards (NAAQS) Table | US EPA | 2024 | PM2.5 annual 9.0 µg/m³ (tightened February 2024); PM10 24-hr 150 µg/m³ |
| [2] | WHO Global Air Quality Guidelines 2021 | World Health Organization | 2021 | 5 µg/m³ annual PM2.5; 15 µg/m³ 24-hr; 2021 tightening rationale |
| [3] | Translocation of inhaled ultrafine particles | Oberdörster et al., Inhalation Toxicology | 2004 | Olfactory nerve UFP translocation; alveolar-to-blood pathway |
| [4] | Particulate Matter Air Pollution and Cardiovascular Disease | Brook et al., AHA, Circulation | 2010 | ~10% CV mortality increase per 10 µg/m³; inflammation, autonomic, translocation pathways |
| [5] | Walking-induced resuspension of particles on synthetic carpet | Benabed et al., Building and Environment | 2022 | PM10 resuspension ~13× higher than PM2.5 during walking |
| [6] | OSHA PEL Table Z-3, Mineral Dusts | OSHA | 1971/current | Respirable dust PEL 5 mg/m³, 8-hr TWA; occupational framework |
| [7] | What is a HEPA filter? | US EPA | current | HEPA 99.97% at 0.3 µm (MPPS); capture efficiency curve |
| [8] | What is a MERV rating? | US EPA | current | MERV 13 ~75% capture at 0.3–1.0 µm; residential HVAC ceiling |
| [9] | Fundamentals of low-cost aerosol sensor design | Kuula et al. | 2024 | Plantower PMS5003 detection floor ~0.26 µm; <14% correct sizing at 1 µm |
| [10] | Impact of Cooking Methods on Indoor Air Quality | Tang et al., Indoor Air | 2024 | Pan-frying median peak PM2.5 ~92.9 µg/m³ |
| [11] | US-wide Correction for PM2.5 PurpleAir Data | Barkjohn et al., EPA | 2021 | ~40% PurpleAir overestimate before correction; humidity bias |
| [12] | Vacuum cleaner penetration assessment | Lisk et al., J. Air & Waste Mgmt. Assoc. | 2013 | Vacuum penetration 2–26% with outliers above 30% |
| [13] | Hinds, Aerosol Technology | William Hinds | 1999 | Hygroscopic growth; humidity effects on deposition and airborne lifetime |
| [14] | Global Connected Air Quality Data Project — US findings | Dyson | 2022 | US annual indoor PM2.5 ~11.59 µg/m³; outdoor ~18.24 µg/m³ |
| [15] | Guide to Air Cleaners in the Home (2nd ed.) | US EPA | 2018 | Source > ventilation > filtration hierarchy |
| [16] | Wood burning is a significant contributor to winter air pollution in Boston | WBUR / Northwestern University | 2026 | 35% of Boston winter PM2.5 from wood burning; transport from suburbs |
| [17] | Xiaomi Mi 2 Auto Mode Leaves Air Above WHO Guidelines | Smart Air | 2024 | Auto mode lag; onboard sensor under-reporting up to 218 µg/m³ |
| [18] | HVAC-Talk: “House is dusty — but only in the winter” | HVAC-Talk forum | 2023 | Seasonal tactile-signal anchor quote (Section 1) |
| [19] | Long-time Austin Air HealthMate owner review | airpurificationeducation.com | 2025 | Heat-on dust trigger quote (Section 3); 15+ year ownership cohort |
| [20] | Indoor Air Quality and Ventilation: OR / patient / home comparisons | ASHRAE | 2020 | OR 20+ ACH; patient room 4–6 ACH; residential ~0.35 ACH |
| [21] | r/HomeImprovement: “My house is making me sick” | Reddit homeowner | 2022 | Travel-test anchor quote (Section 11) |
| [22] | AHAM Air Filtration Standards | AHAM | current | 4.8 ACH health-benefit standard for portable air cleaners |
| [23] | r/Allergies: “Indoor air test normal, what could be the reason?” | Reddit homeowner | 2024 | “Tested normal, still feel bad” quote (Section 12) |
| [24] | Why Your Mold Inspection Found Nothing (But You’re Still Sick) | Indoor Environmental Testing Inc. | 2025 | Industry framing of “tested normal, still sick” arc |
| [25] | Should I Test My Indoor Air? Fact Sheet | Connecticut Dept. of Public Health | 2024 | No health-based standards for indoor mold; interpretation challenges |
| [26] | Ozone Generators that are Sold as Air Cleaners | US EPA | current | Ozone + VOCs → formaldehyde + ultrafine secondary particles |
| [27] | Hazardous Ozone-Generating Air Purifiers | California Air Resources Board | current | CARB 0.05 ppm ozone limit; banned-device list |
| [28] | Hierarchy of Controls | NIOSH (CDC) | current | Elimination > Substitution > Engineering > Administrative > PPE |
| [29] | Health Risks of Indoor Exposure to Fine Particulate Matter | NASEM | 2024 | No US federal indoor PM2.5 standard; consensus review of indoor PM health |
| [30] | Thoracic and respirable particle definitions for human health risk assessment | Brown et al., Particle and Fibre Toxicology | 2013 | ICRP-66 regional deposition fractions; alveolar surfactant thickness |
| [31] | Low readings from PMS5003 sensors — batch analysis | AirGradient | 2023 | Consumer sensor under-reporting up to 30× at low concentrations |
| [32] | Air Purifier Placement Tests | Smart Air | 2023 | Corner-placement purifier delivers <10% of optimal performance |
| [33] | Vacuuming is Making Your Allergies Worse | Corsi et al. | 2008 | Post-vacuuming airborne particle levels 2+ hours to return to baseline |
| [33b] | 1-minute peak cooking PM2.5 concentrations | Zhao et al. | 2021 | Kitchen 1-minute peak PM2.5 during typical cooking: 200–1,400 µg/m³ |
| [34] | HEPA vs HEPA-type: What’s the Difference? | Molekule | 2024 | “HEPA-type” filter capture 85–90% at 0.3 µm; 15× more pass-through vs True HEPA |